 |
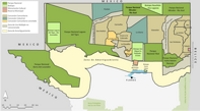
ZONING OF THE MBR: The MBR is made up of a combination of strict protected areas (five National Parks, four wildlife reserves or Biotopes, and one Cultural Monument), the Mulitple Use Zone, and the Buffer Zone. In the Muliple Use Zone, designated for the sustainable use of natural resources, there are ten forestry concessions managed by local communities, and two forestry concessions granted to private industry. |
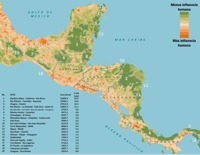 |
THE MBR IN MESOAMERICA: An analysis of Mesoamerica based on the methodology of the global Human Footprint project identified the 20 largest wilderness areas (defined as those with the least amount of human influence) in the region. This analysis determined that the largest patch exists across the tri-national block composed of the Maya Biosphere Reserve, the Rio Bravo Conservation and Management Area in Belize, and the Calakmul Biosphere Reserve in Mexico. This block of forest represents 23% of the total area inside all 20 identified wilderness areas. |
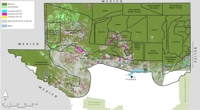 |
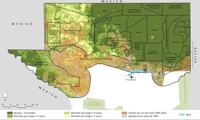
CHANGES IN FOREST COVER, 2006-2010: Continuous evaluations of forest cover changes have enabled the tracking of land use change dynamics in the MBR. The map summarizes recorded changes between 2006 and 2010.
|
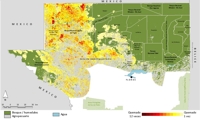 |
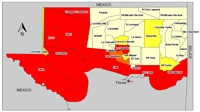
FIRE RECURRENCE, 1998-2010: Fire is one of the most significant problems for the future of the MBR. Recurring fires caused by a combination of adverse climatic conditions associated with el Niño events and careless use of fire as an agricultural tool have severely transformed some areas of the MBR. The map shows these data for the years 1998-2010.
|
 |
MODIS `HOTSPOT’ STATISTICS (requires Flash): This interactive map shows an analysis of MODIS Hotspots, classified by management area, throughout the period for which there are available data. The map permits a temporal analysis of these data, as well as a comparison of MODIS Hotspots recorded in different management areas.
|
 |
THE MBR TODAY: LAND USE CHANGES AND FIRE: The combination of forest cover change and fire recurrence data permits a view of the current state of the MBR, with respect to the impacts produced by these two factors. The map shows data grouped by level of fire recurrence as well as forest cover changes that have occured since the creation of the MBR. |